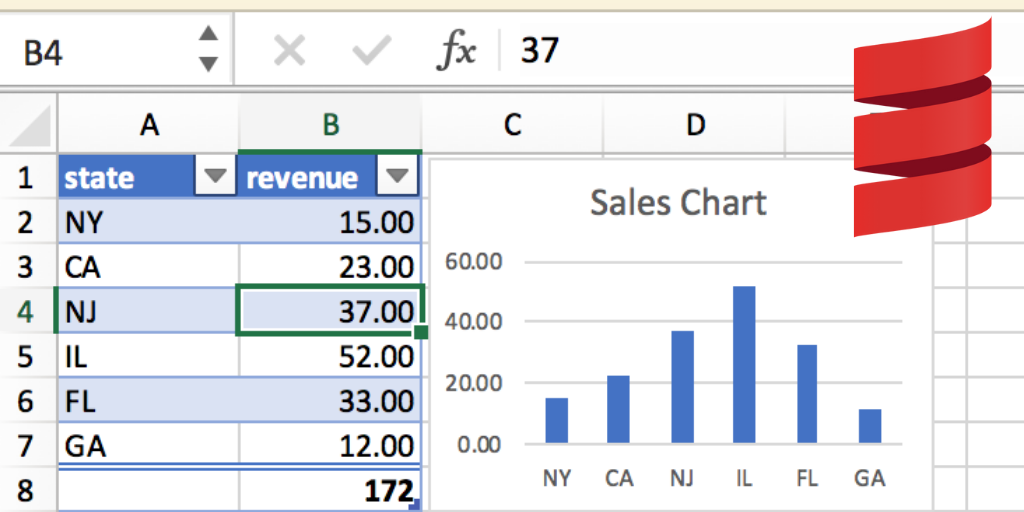
When we build applications that need to present complex numeric information to users, it’s inevitable that sooner of later we will have to find a way to show graphs of that information to the user. There are many graphing libraries, but they often look bad and they tend to be very hard to work with. Luckily, there is an application from Microsoft which has already considered many of the issues related to presenting numeric information: Excel!
Excel provides a simple way to work with numerical information to users. It’s been one of the most popular business applications of all time, so many users know already how to use it. It makes sense to consider Excel spreadsheets as an output format for those business applications which need to do reporting on numbers in a rich format complete with graphs and calculated fields. A nice extra feature of reporting in spreadsheet form is that the user can play with the information. For example, (s)he can create a pivot table from it and rotate the data, which helps bring the report alive.
Many financial applications now report in Excel format and the best known library to create these spreadsheets programmatically is POI. POI has been around for a long time and it is relatively easy to use. Most of the questions using POI are related to manipulating spreadsheets so that they can easily be merged or enriched with dynamically generated data.
When we use Excel as a reporting format, obviously we will want to inject dynamically generated data into the spreadsheets. If we didn’t do this, we would not be building “reports”. One can do this brute force by creating the spreadsheets from scratch from our custom applications which need to produce the Excel report, or we can do this in a smarter way where we build the spreadsheets as we would normally build spreadsheets, but using sample data, then allow our application simply to replace the sample data in the spreadsheets.
Why not hand-generate the spreadsheets?
Think of all the fancy GUI functions of Excel! It let’s you do so much so quickly. Its graphical UI will do much of the heavy lifting for you, so you don’t have to calculate references and you don’t have to manually fix the settings for each graph. This is precisely why people like using it in the first place. Now, think of you having to do all of this by hand. That is what we do when we use a graphing library: we custom-code everything. This doesn’t really make any sense in many cases, when building spreadsheets programatically.
So what is a “smarter” way
We can build Excel spreadsheets using the Excel app, then name tables and regions in a way that will become easy to replace programatically. Note, that this is where we normally run into issues. For example we can put our sample data into Excel and create a table out of it, then create a graph based on that table. Using POI, we can replace the sample data expecting that is all we have to do. But when we open the spreadsheet we quickly realize that the graph is broken and so is the table that it’s based on. After copying in the sample data, the references will no longer work, the totals will be wrong, and many things will simply be wiped out, because we overwrote them when we copied in our dynamic data.
Follow these steps to assure that critical pieces of the spreadsheet are preserved: Tables, regions, totals, and graphs.
The source code my Scala POI wrapper can be found on GitHub: https://github.com/kornelc/scala-poi.git
Steps to take in Excel:
Create a spreadsheet in .xlsm format

Open up Excel and create a spreadsheet with one sheet in it. Save this new blank spread sheet in .xlsm format.
Create a table using sample data
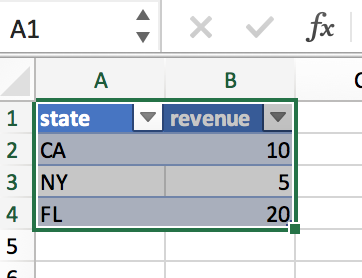
We will use Excel tables to store the data in the spreadsheet. This has multiple advantages:
- Tables were designed to work with changing data and so this makes it easier to work with them when we expect to work with dynamic data
- Tables allow the definition of ranges for table columns without using cell references. This means that we have a “higher level” way of referring to a column, that will stay valid even after the data changes. This makes our spreadsheets less “fragile” as the data changes. We want our graphs to keep working as much as possible after we copy new data in.
- The data will have an aesthetic table look and feel that makes it visually appealing to the user
Create totals for your table
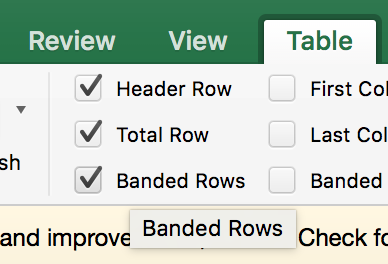
Define the table totals how you would normally do for Excel tables (select table data + Ctrl-T) and make sure you check “Total Row” from the Table menu, to make the totals visible.
Name your table
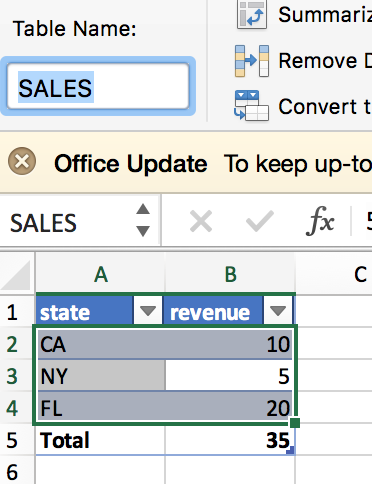
We want to make sure we name our table, so that we can refer to it from formulas elsewhere. We can do this by selecting the Table menu and entering a name there.
Create named regions in terms of your table
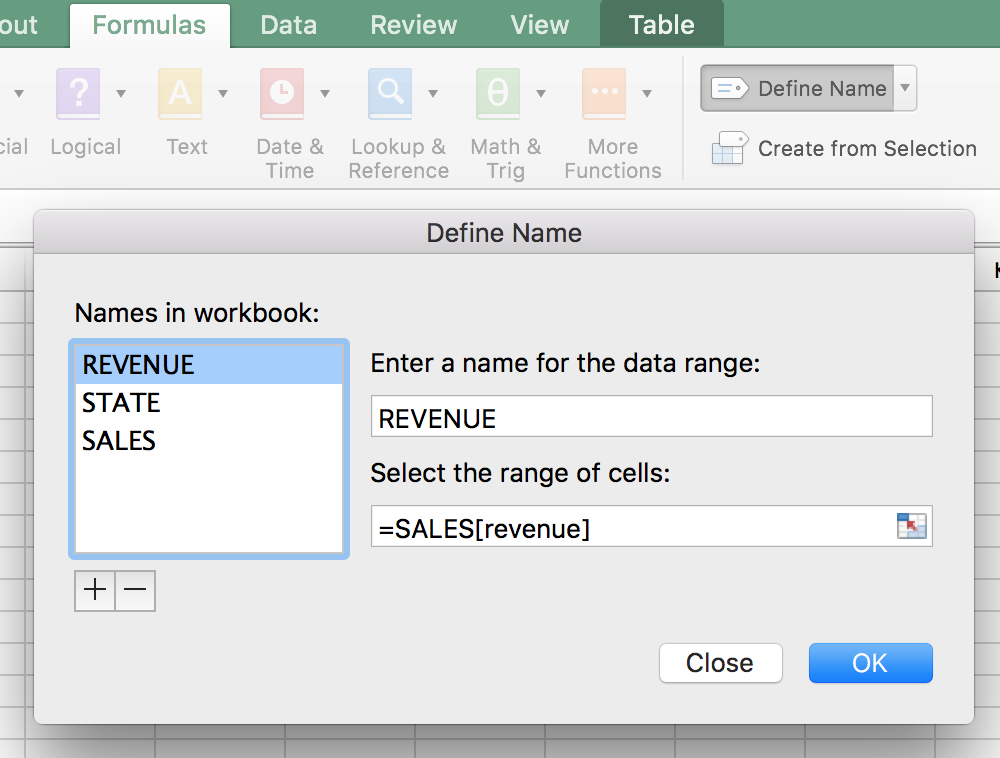
I found that when I created named regions from the formulas menu and defined them in terms of table references, then using those formulas elsewhere such as in defining axes for graphs, the references automatically resized. For example we can create a graph and use a named region for its axes. If that region is based on a table column e.g. MY_TABLE[myCol], and we change the data in the table column, the graph will repaint. This is exactly what we want for our reports!
Create graphs in terms your named regions
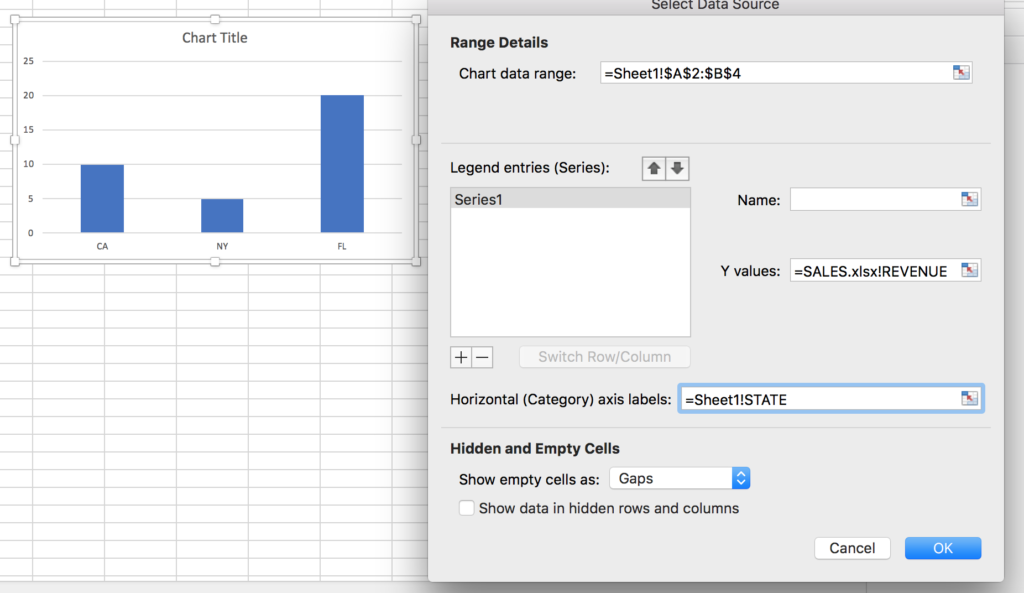
Create the graphs in terms of our named regions. When select data, we use the spreadsheet name and the region name to create a dynamic reference that will make the graph recalculate as the data changes.
Steps to take in code using Apache POI:
Save your total formulas that you created with Excel
The following will find and save the formulas we created with Excel, assuming that the table is in the first row and first column within it’s sheet. If we don’t do this before we copy in the data, we will wipe out our table totals:
    val data: Array[Seq[_]]) = ???

    val oldTotalRowIndex = table.getEndRowIndex
    val tableWidth = data(table.getStartRowIndex + 1).length -1

    val totalCellFormulas =
      (for(c <- 0 to tableWidth)
        yield Try(Option(sheet.getRow(oldTotalRowIndex).getCell(c).getCellFormula)).getOrElse(None)).toList
    totalCellFormulas.foreach(f => println(s"FORMULAS: $f"))
Save the style of data cells in the table
We want to make sure that all the data we copy into the table will have the styling that we put in when we created the spreadsheet through the GUI. Again, the goal here is to allow as much of the work to be done trough using Excel, and limit our programatic intervention to the absolute minimum. We will take cell samples from the first data row, and will use that as a template for the rest of the data rows:
  val templateCellFormats =
      (for(c <- 0 to tableWidth)
        yield sheet.getRow(0).getCell(c)).toList
    templateCellFormats.foreach(f => println(s"FORMATS: $f"))
Copy in our dynamic data
The following will make room for the data by resizing the table and copy the data in Java Beans style, using setters and getters, into the table.
table.setDataRowCount(data.length)

for (r <- 0 to data.length-1) {
      val row = sheet.createRow(table.getStartRowIndex + r +1);
      for(c <- 0 to data(0).length -1) {
        val cell = row.createCell(c)
        cell.setCellType(templateCellFormats(c).getCellType)
        cell.setCellStyle(templateCellFormats(c).getCellStyle)
        val field = data(r)(c)
        if (field.isInstanceOf[String]) {
          cell.setCellValue(field.asInstanceOf[String])
        } else if (field.isInstanceOf[Double]) {
          cell.setCellValue(field.asInstanceOf[Double])
        }
      }
    }
Yes, this is terrible looking Scala code. But let’s not forget we are using an old Java library, so we follow the programming paradigm of the Visual Basic era!
Put back in the totals
We saved the totals formulas earlier. Its time to put them back in. When you run the code, you will notice that the totals formulas are defined in terms of table columns, not cell references. This means they will still work in their new positions. They will just take their data from the current version of the table.
 val totalRowIndex = table.getStartRowIndex + data.length + 1
    val totalRow = sheet.createRow(totalRowIndex)

    for {
      formulaOpt <- totalCellFormulas.zipWithIndex
      formula <- formulaOpt._1
      column = formulaOpt._2
      _ = println(s"Creating total cell in row $totalRowIndex col $column")
      totalCell = totalRow.createCell(column)
      _ = totalCell.setCellFormula(formula)
      _ = println(s"Written total row in $totalRowIndex $column $formula")
    }
That’s it we’re done! If you are using the class I put out on GitHub, all you need to do is create the data you want to put in the ranges and call replace as follows. Then all the above work will be done for you by the code in the class:
  Excel.replaceRegions(
      Map(
        "SALES" -> a data frame of your data with at least the cols you need in the spreadsheet),
      ),
      "src/main/resources/templates/SALES.xlsm",
      "/tmp/out.xlsm")
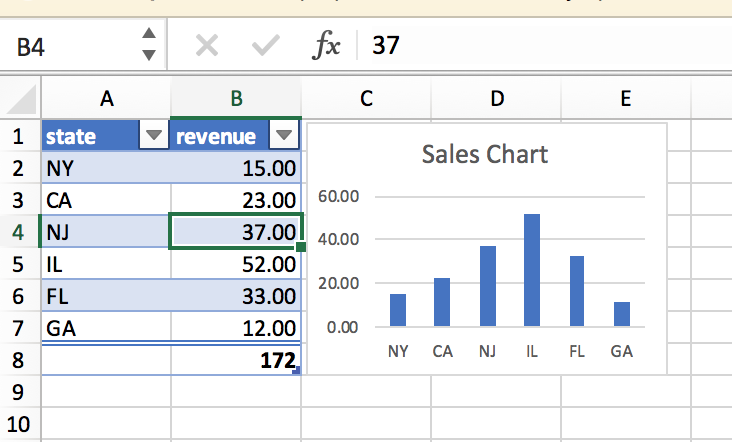
This is what the spreadsheet out.xlsm will look like
Conclusion
By building our spreadsheets in clever way, we were able to keep the actual coding we have to do to a tiny class. We did almost everything we had to do via Excel’s excellent GUI! We used tricks that we observed from working with Excel, to build the spreadsheets in a way the graphs and totals would recalculate automatically after we programmatically copy in our dynamic data. As a result we allowed our business users to build the spreadsheets who are generally more qualified than typical coders to build the domain specific spreadsheet models. As a bonus, we created reports which can be manipulated and further analyzed by business users by “playing” with and rotating the data in the reports interactively from Excel.
